

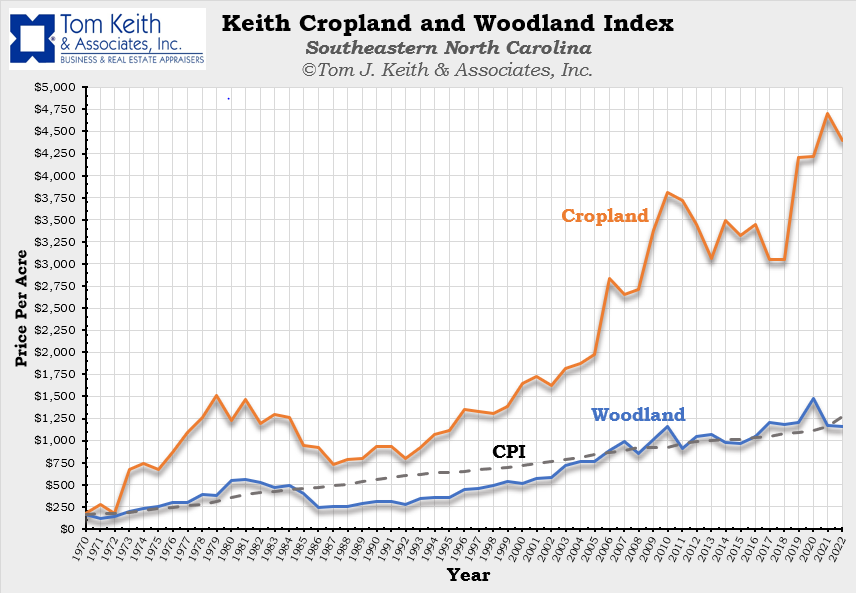
The staff of Tom Keith & Associates, Inc. has been collecting crop and woodland sales data in Southeastern North Carolina since 1970, which has allowed our appraisers to track and retrospectively determine reliable valuations on crop and woodland. The Keith Cropland and Woodland Index shown above exhibits the average price per acre of cropland and woodland data that has been extracted from farmland and woodland comparable sales from multiple rural counties in the North Carolina Area. The solid orange line depicts the change of price per acre of the collected cropland data, while the solid blue line represents the change of price per acre of the collected raw woodland data. It can be noted that as of 2022 prices for cropland averaged around $4,500/Ac. and woodland averaged around $1,100/Ac.
The cropland and woodland markets are fairly correlated due to the ability to clear woodland for annual agricultural crops and vice versa. It is attempted to be avoided by this study, but there is likely also a small amount of development demand for some of the tracts, which leads some farmers and owners to consider that at some point in the future this property could be sold or developed and bring a greater return. See the table below, which indicates grain prices from 1970 – 2008.
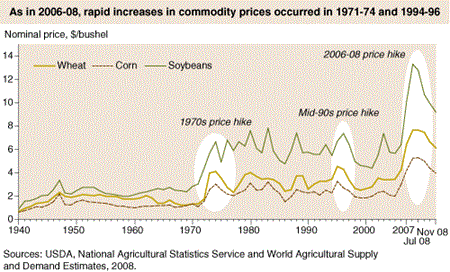
Since 1970 there have been multiple significant swings in the price per acre starting with a considerable boom and upswing throughout the 1970’s. This strong market for grain was caused by a mixture of global market demand and shortfalls in supply due to adverse weather conditions. One of the major events involved the Soviet Union’s unexpected purchase of a large amount of grain throughout the early 1970’s. Some other issues involved the inflation of the U.S. Dollar and the reduced stockpiles due to countries cutting government costs in the late 1960’s.[i]
In the 1980’s slowing inflation appeared to play some role in the lowering of prices along with surpluses and an overall decrease in demand from the global and local markets.[ii] Moving into the 90’s there was some of the same, but with 3 consecutive years, 1994-1996, of below normal harvests in the major grain exporting countries. Note that as local cropland and woodland prices did fall throughout the late 1980’s the prices remained on par with the CPI’s Inflation trends going back to 1970. As the 1990’s brought higher grain prices, the cropland and woodland prices follow.[iii]
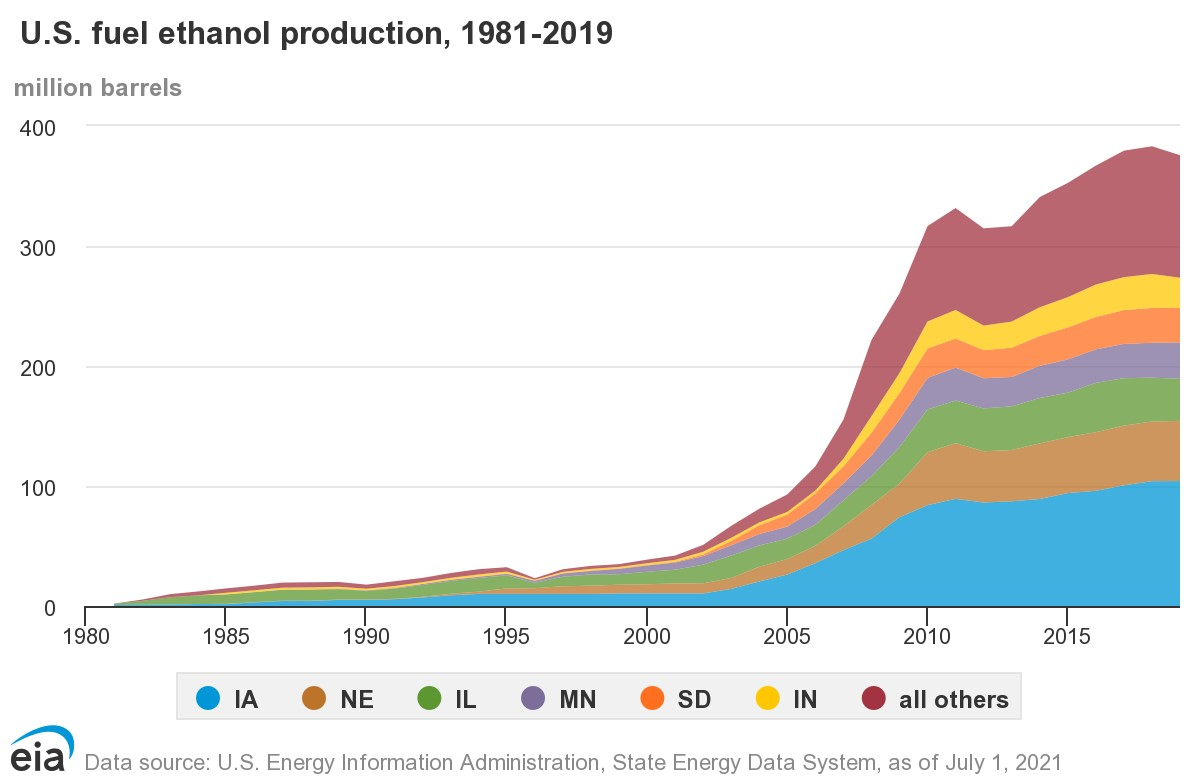
Going into the 2000’s there is a large increase in the use of Ethanol, which is made from Corn and this increase plays a significant role with increasing grain prices and increase in land prices. If the U.S. Fuel Ethanol Production chart and the Keith Farm and Woodland Index are compared side by side, a direct correlation in trends can be seen from 2000 to 2019.[iv] Most notably a peak around 2010 and then again in 2018-2020 in both grain and land prices.
As history has shown and as logic would establish the prices of grain and other commodities in agriculture has a very real and direct impact on cropland and woodland tracts in southeastern NC. The correlation of the national and international market is important to understand when buying or selling cropland in rural areas. Most importantly it should be noted that to some degree cropland and woodland are protected from troughs and downturns in the local development market, which provides the investors with lower risk and therefore, lower return and yield rates.
[i] https://www.ers.usda.gov/amber-waves/2009/march/agricultural-commodity-price-spikes-in-the-1970s-and-1990s-valuable-lessons-for-today/
[ii]https://www.nass.usda.gov/Publications/Trends_in_U.S._Agriculture/Land_Values/ index.php#:~:text=However%2C%20in%20the%20mid%2D1980's, a%20decline%20of%2025%20percent.
[iii] https://aei.ag/2020/11/30/the-farm-economy-inflation-and-the-1970s/
[iv]https://www.eia.gov/energyexplained/biofuels/ethanol-supply.php#:~:text=Total%20annual%20fuel%20ethanol%20production,gallons%20 (0.4%20billion%20barrels).


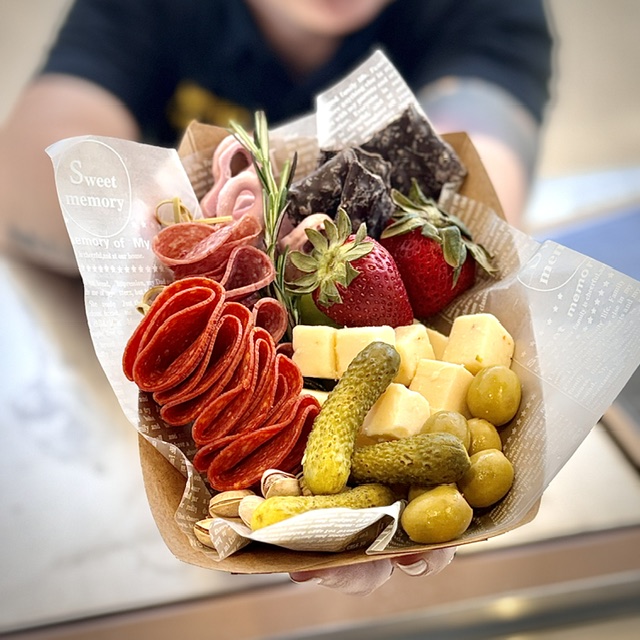
Once Upon a Bite launched in early 2026 and has continued to grow through local markets, festivals, private events and community partnerships throughout the Fayetteville area.

Photo provided by Skin Specialists of FayettevilleA Veteran-owned Fayetteville medical spa that launched during the COVID-19 pandemic has grown into a multi-disciplinary aesthetics and wellness practice — winning the 2024 Readers’ Choice Award for Be

Josh Buracchio and his wife Gina had a vision two years ago: to bring the best of their beloved Pittsburgh’s culinary scene to Fayetteville.